Wilson
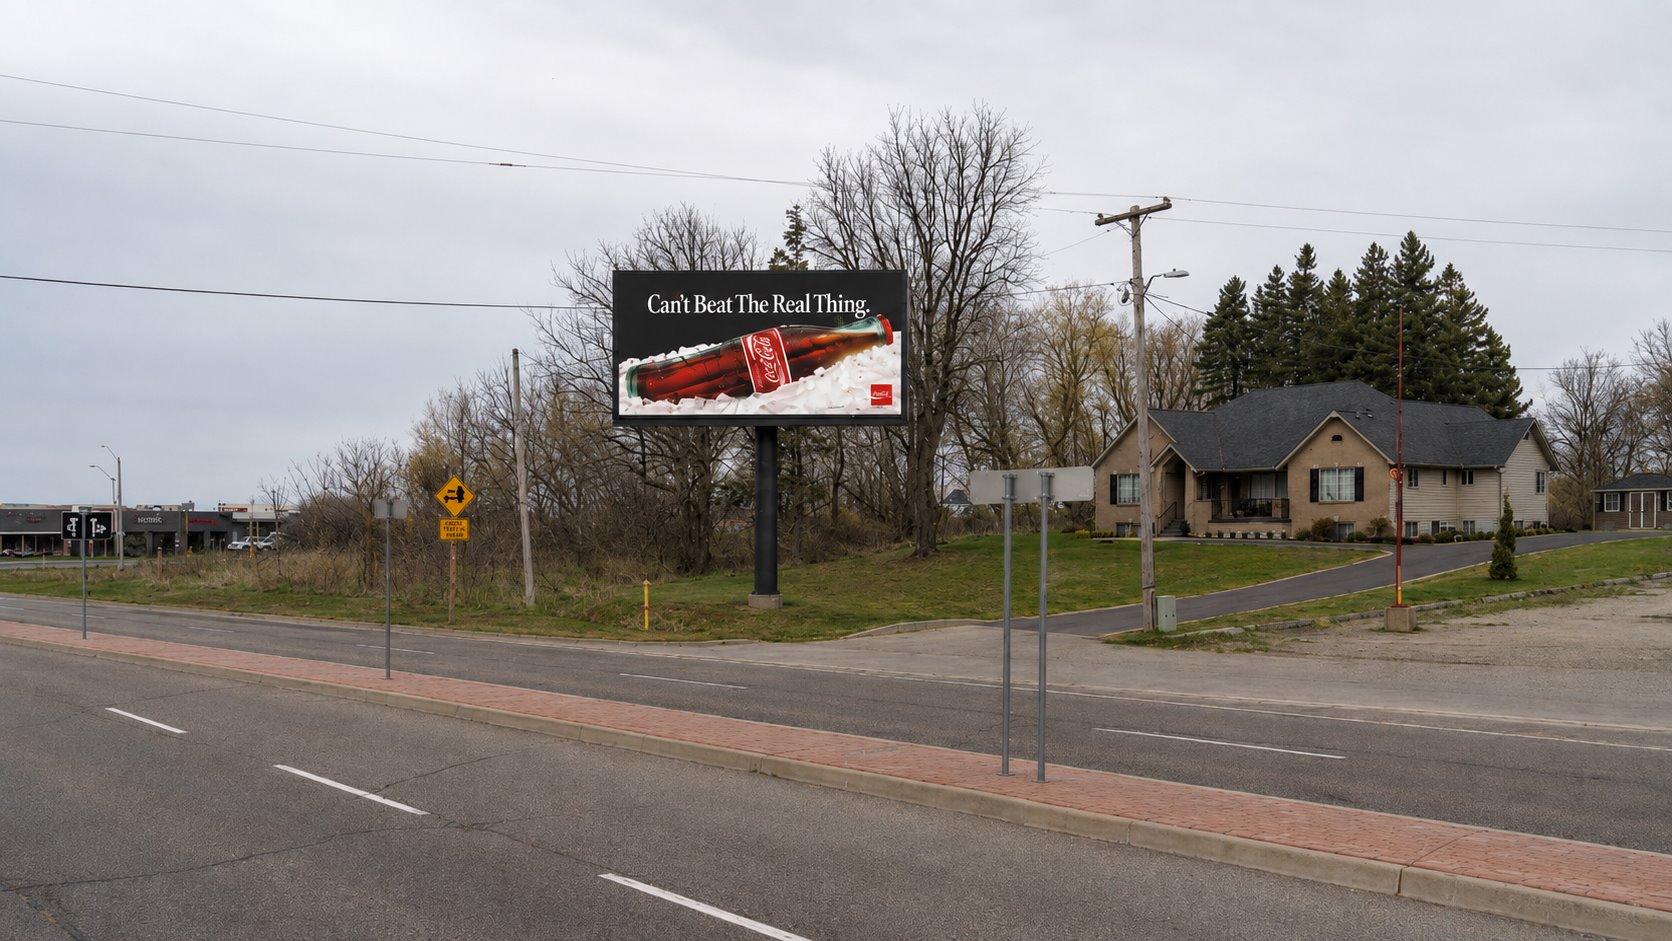
1089 Wilson St W · Ancaster · 43.199276, −80.017355
900,000+
Impressions / month
Five double-sided digital billboards across four Ontario markets. 5.22 million impressions a month, in front of people who are already out and already spending.
Every other screen can be closed, muted or scrolled past. Ours is the one medium that has to be looked at. Physical, unavoidable, and standing exactly where the buying decision gets made.
5
Locations
5,220,000+
Impressions / month
4
Ontario markets
Select to move the map
1089 Wilson St W · Ancaster · 43.199276, −80.017355
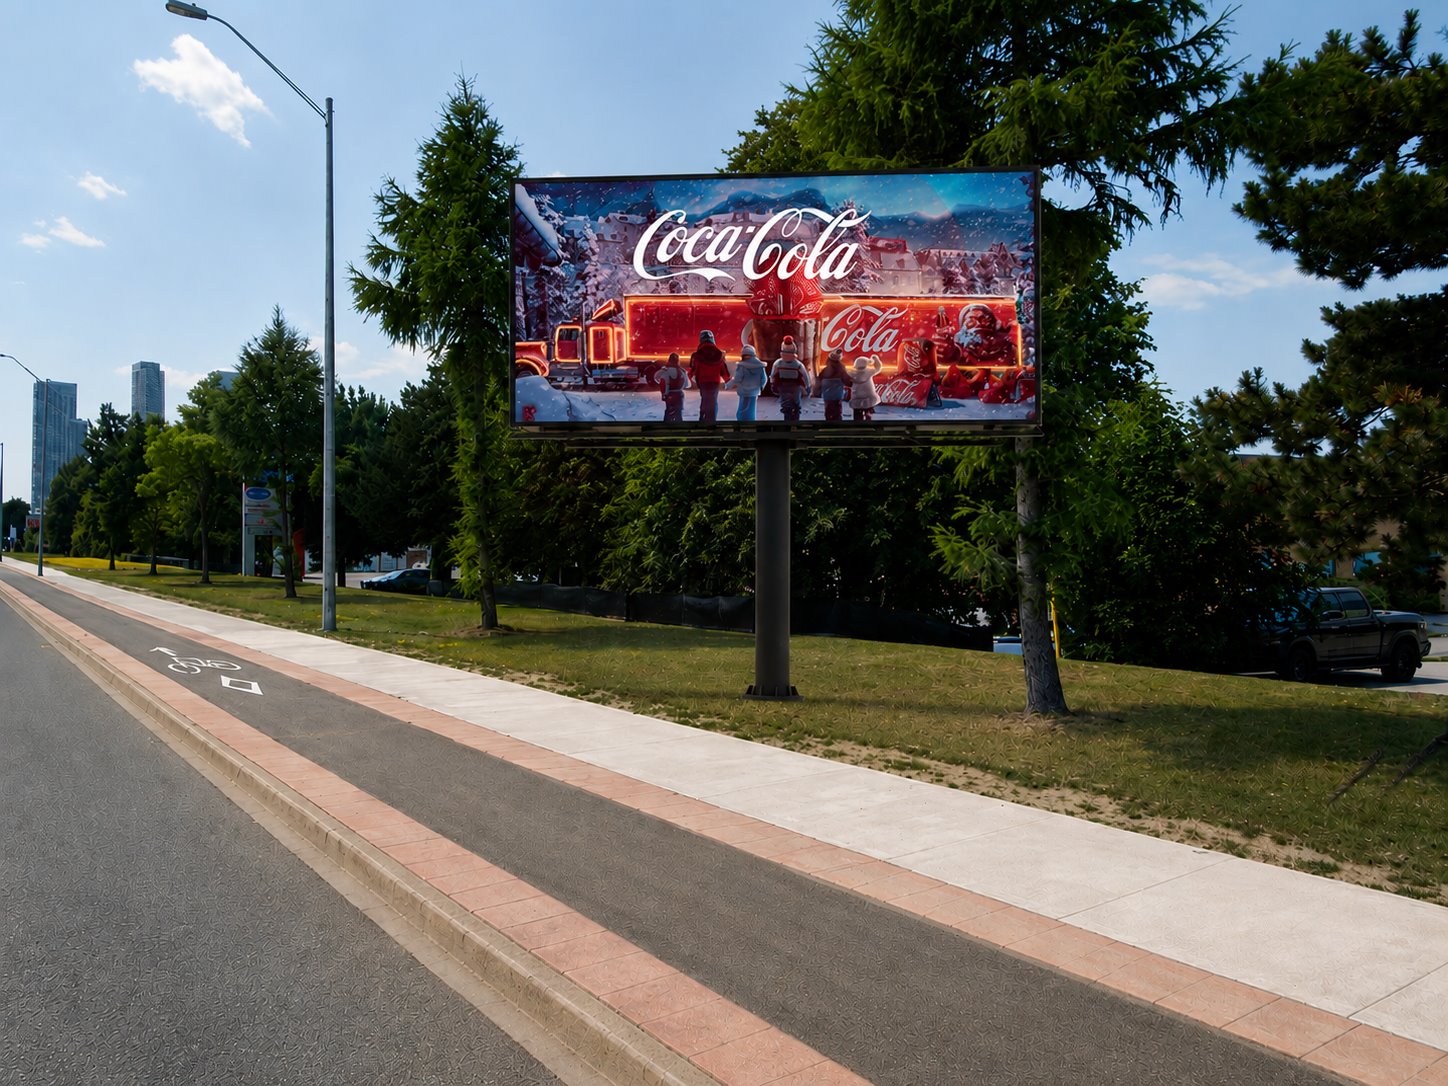
535 Millway Ave · Concord · 43.807821, −79.527751
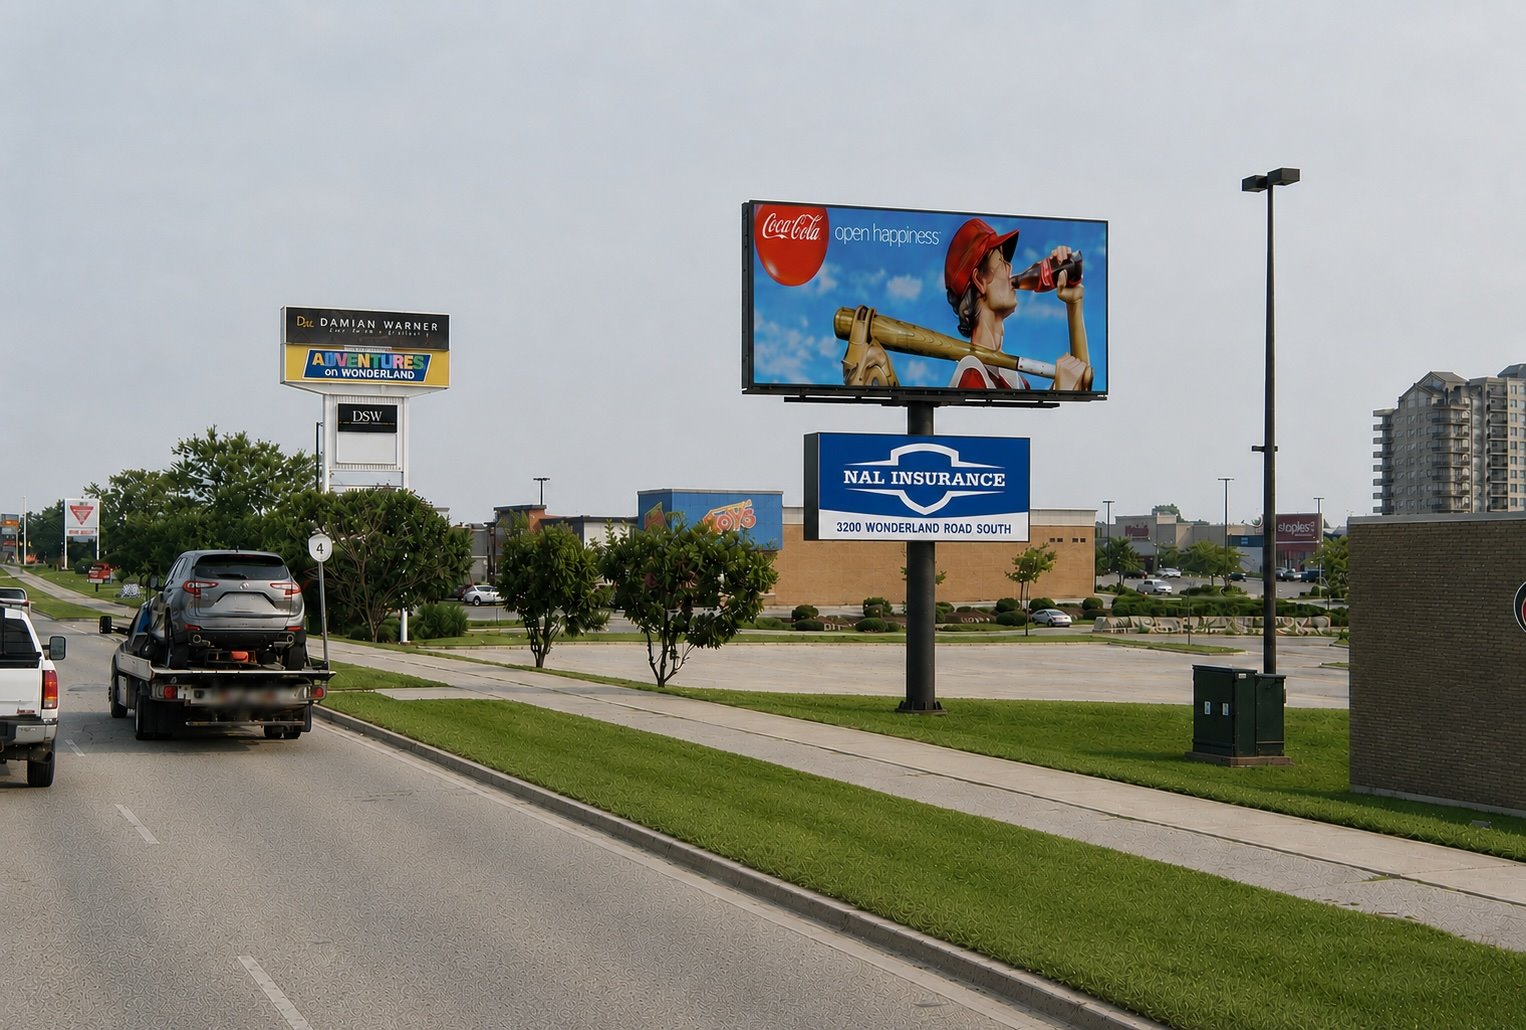
3200 Wonderland Rd S · London · 42.933851, −81.279946
9 Southdale Rd E · London · 10×35 & 10×20 ft · 42.940159, −81.257716
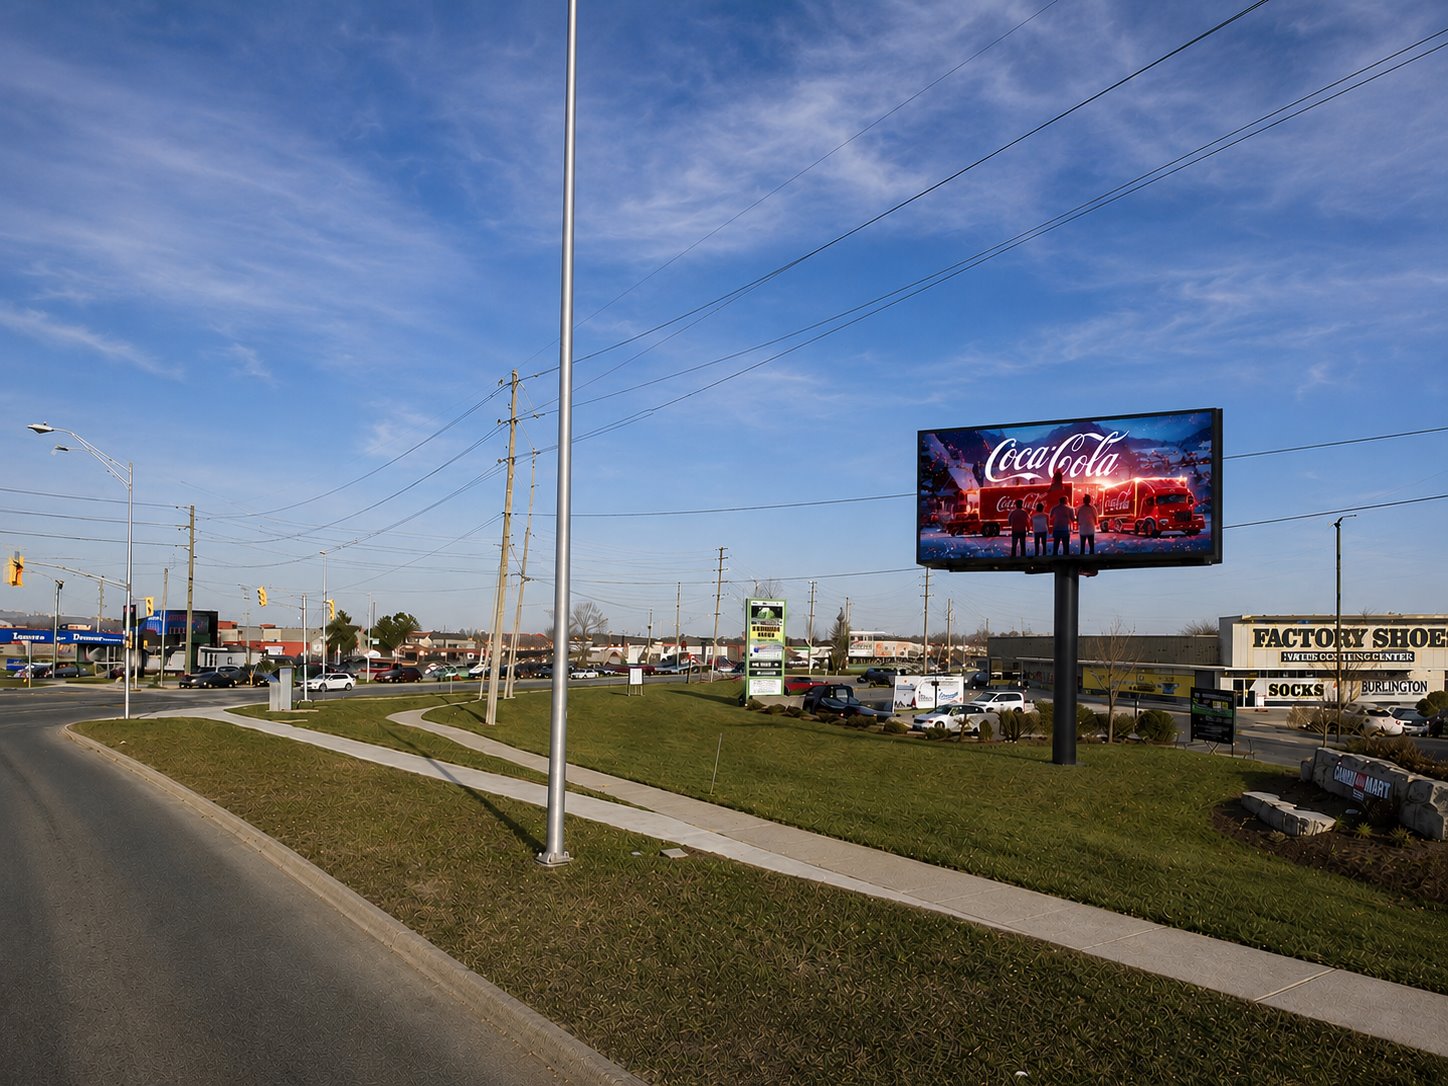
1400 Rymal Rd E · Hamilton · 43.187053, −79.830767
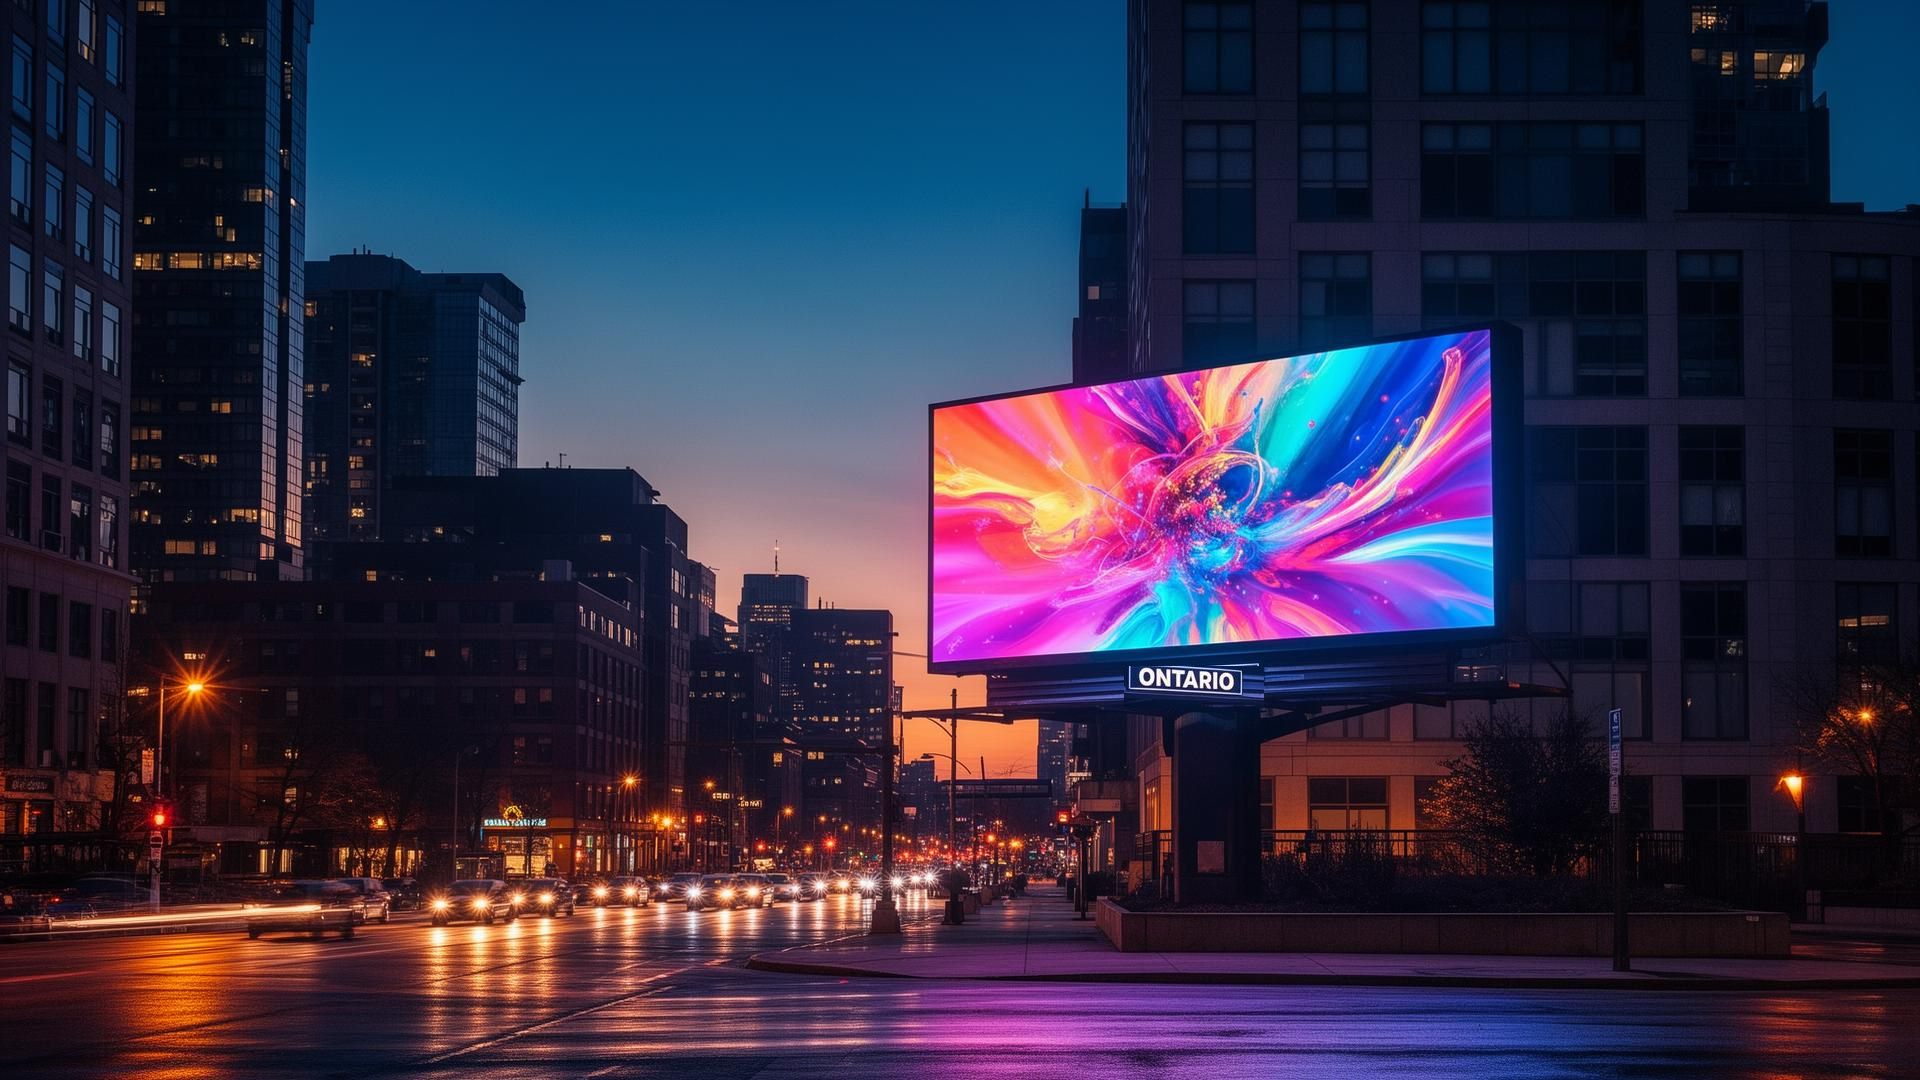
Built to be seen from a distance, remembered up close, and impossible to look away from in between.
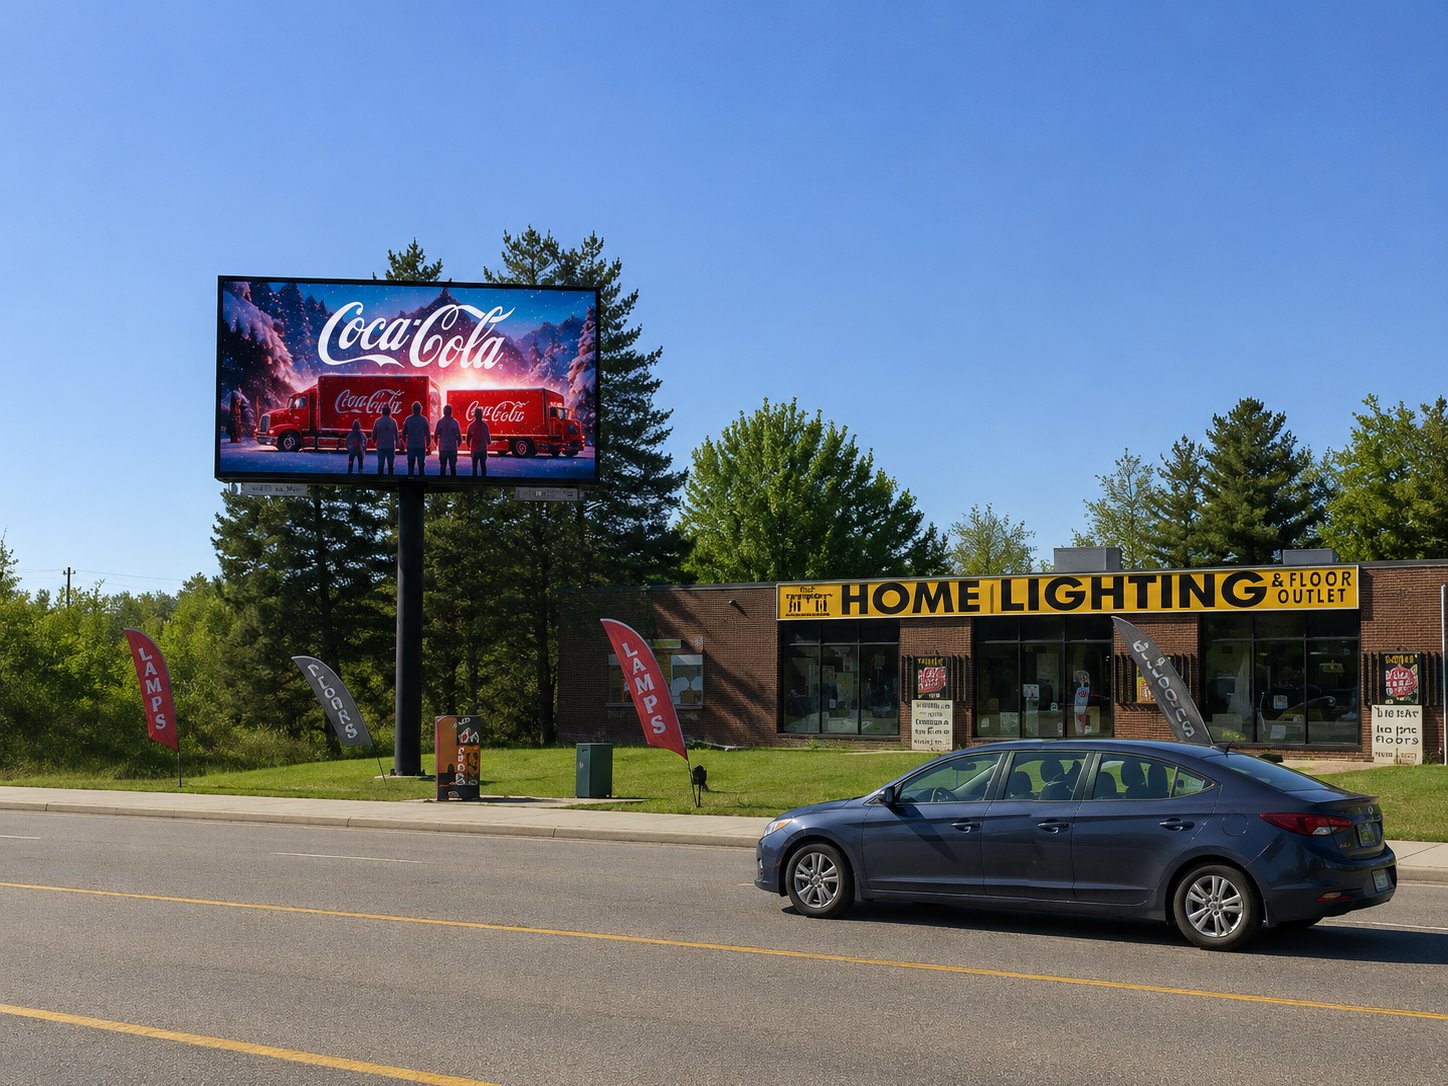
These are LED screens, not pasted vinyl. Run an offer this week and a different one next week. No reprint, no install crew, no extra cost.
Slots run on a six or ten second rotation depending on the board. Match the message to the hour, the weather or the weekend.
Every board in the network is double-sided. You get the morning commute and the drive home for one buy, not two.
Big screens. Big environments. Big attention. Nothing else in the day is this size.
The right message, in the right place, at the moment it can still be acted on.
The same commute, twice a day, five days a week. Repetition turns a name into a habit.
Pick a board and a run length. Every figure below comes from that board’s own traffic count, not an average across the network.
Traffic count at that location each day
Where these numbers come from. Impression figures are the traffic count at each location, multiplied by 30 for a month and by 7 for each week of a run. A campaign total assumes a continuous booking. ROAS is an industry benchmark adjusted for rate, not a forecast of your result. Published research puts out-of-home at an average of $5.97 in sales per $1 of ad spend, the 597% shown on a twelve-week run. Longer bookings earn a lower weekly rate, so the same impressions cost less and the estimate rises to 716% at twenty-four weeks; shorter bookings pay more per week, so it falls to 478% at four. Source: Benchmarketing (Omnicom Media Group) research commissioned by the OAAA, reported in “New Study: Media Plans Optimized with Higher Investments in OOH”, oaaa.org, 2018. That is a category-wide average across multi-channel campaigns, and individual results vary.
Impressions / month
Eyes on the board every month
Over your 12-week run
Total campaign impressions
Estimated ROAS
Choose your market
Choose your screen
Send your creative
Go live
We run five boards, not five hundred, and every one is published with its real size, facing, slot length and monthly impressions. Tell us the market and roughly when you want to run, and a rate comes back the same week.